Highlights of part I – Macro Fundamentals
In the first part of this seminar we begin by defining what heterodox economics is and how it differs from the orthodox approach.
We then introduce a fundamental approach that allows to consistently explain macroeconomics fluctuations: the sectoral balances approach. We divide the economic system into 3 sectors (Private, Public and Foreign) and analyse how they work and interact with each other.
Orthodox and Heterodox
The first step of this seminar is to clarify what heterodox economics is and how it differs from the orthodox approach.
Orthodox macroeconomics identifies the most recent and dominant economics theories and schools of thought, the predominant approach followed by the mainstream. I will hereafter use the terms orthodox and mainstream as surrogate.
Today the orthodox macroeconomic approach is the Neoclassical Economics. You all have come across it; starting from schools, throughout universities and work places. It is likely to be the only macroeconomic approach you ever heard of.
Orthodox economics in one sentence:
The study of allocation of scarce resources among unlimited wants.
The foundations of orthodox economics:
- Natural (individualistic) human behaviour.
- Individuals are rational: maximise own utility under constraints, they only care about their own pleasure and disregard other individuals.
- Equilibrium: set of prices that clear the markets; these prices constitute an invisible hand that leads individuals toward
maximum utility. - Trade-off in resources allocation.
- Government has secondary or no role: its only purpose is to provide what the free market cannot, like military defence.
Heterodox economics, although being the key for understanding modern economies, it is still unknown to most people (be it students or professionals). I wouldn’t be surprised if you never heard about it.
Heterodox economics in one sentence:
The study of social creation and social distribution of society’s resources.
The foundations of heterodox economics:
- Social human behaviour: cooperation is key to survival
- Equilibrium: prices reflect many non-rational and non-economic factors
- Resources are socially created and distributed
- The government has a central role
An overview of the relative macroeconomic theories.
This is just an overview of the main post-classical macroeconomic schools, I am not going to explain each of them in details (at least for now).
Orthodox economics
- Neoclassical/Marginalist approach
- New Classical (Lucas, Phillips, 40s)
- Real Business cycle (Chicago school, 80s)
- Supply side economics (M. Thatcher, R. Regan)
- Austrian school (F. Hayek, L. von Mises)
- Neoclassical Keynesian
- New Keynesian (P. Samuelson, R. Solow)
- New Monetary Consensus (M. Friedman)
Heterodox economics
- Institutionalist (T. Veblen, J. T. Commons, J. K. Galbraith)
- Keynes and Post-Keynes (M. Kalecki, J. Robinson, P. Davidson, H. Minsky, J. Kregel)
- Marx approach (K. Marx, V. Lenin, M. H. Dobb, P. Sweezy)
- Modern Monetary Theory (W. Mosler, R. Wray, S. Kelton)
The macroeconomic sectors
We begin by defining two important terms that will be used often hereinafter.
Individual: it is a natural or legal person living and acting in a certain country.
Monetary decision: any decision taken by an individual involving a monetary transaction. So, lending 100$ to your best friend is an economic decision, lending him your car is not.
You, as an individual are part of a macroeconomic system. Every monetary decision you take (spending, saving, borrowing money, travel around the world, etc…) has a direct effect on this system as well as the other individuals co-existing in it. The same applies for all other individuals existing, operating and interacting in this macroeconomic environment, their monetary decisions will affect you.
![]()
Let’s pick a country of residence (you have to live somewhere) and start defining the macroeconomic environment.
Let’s say you live in Ireland (you can pick any country on this planet, the same reasoning applies), your macroeconomic environment is built on 3 main sectors:
- domestic public sector
- domestic private sector
- foreign sector
The domestic public sector contains all the domestic government entities, hence the central government (the State), the local governments (regions, counties and municipalities) and the public authorities (profit and non-profit organisations owned and run by the government).
The domestic private sector contains everything which is not public, hence households, firms and private non-profit organisations.
If we merge domestic public and domestic private sectors we get the domestic sector, the State you live in.
All public and private entities outside the domestic space belong to the foreign sector, or rest of the world.
The macroeconomic sectors:
- Domestic public sector
- Central government
- Local government
- Public authorities/agencies
- Domestic private sector
- Households
- Firms
- No-profit organisations
- Foreign sector
- Foreign entities, private and public
The environment built upon these 3 sectors is nothing less than the Planet Earth and this means that the system is closed because, as far as I know, we don’t have any ongoing economic relationships with any other planet in or outside the solar system.
This closed-system principle is fundamental for understanding the relation between the 3 sectors as well as the consequences that each action taken by one sector has on the other two.
In this closed-system everything that moves from one sector has to go at least to one of the other two, if one sector is giving at least one of the other is receiving. 
The figure above gives you a visual idea of the closed 3 sectors system. Every economic decision taken by an individual produces an effect on at least one of the 3 sectors, it can neither affect none of the sectors at all nor a hypothetical fourth sector.
Imagine you are the person owning that money located in the private sector (green box) you can decide what to do with that sum:
- pay taxes, so the money goes to the public sector (to the government)
- go to the restaurant, the money remains in the private sector
- save for the future, the money remains in the private sector
- go on holiday abroad, they money moves to the foreign sector
The closed-system implies another important element, if one is winning, by identity, at least one of the other two is losing. If none is winning then none is losing either. One sector loss corresponds to a win for at least one of the other two.
The figure below shows this win-lose concept. For simplicity we assume that the Foreign sector is in balance (neither winning nor losing), the only possible cases are the top left and top right where either the public sector is winning and the private losing and vice versa.
Bottom left and right cases are impossible, you can’t have both sectors winning (having the Foreign sector in balance of course).
Let me give you an example for clarifying this concept. Imagine a league with 3 rugby teams where each team is playing against each other. Assume that one team decides to leave the league, only two contender are left, hence only two outcomes are possible: the team Public wins and the team Private loses or Public loses and Private wins. They can’t both win as well as they can’t both lose, at most they can draw.
Later in the seminar we will lift the assumption of the Foreign sector being in balance and we will examine how this will allow a situation where both Public and Private can actually be on the winning (or losing) side at the same time.

There is actually a third scenario that I didn’t specifically include here but it is still theoretically possible, the one where all the 3 sectors are in balance.
Here comes another example, this time exploiting the game Monopoly.

Think about the game Monopoly played by several opponents (I will use Monopoly a few times to exemplify macroeconomic concepts).
During the game, the players compete against each other and they all compete against the Bank.
In this case the players are the domestic private sector while the Bank is the domestic public sector.
When the game starts the players and the Bank have an initial stock of “wealth” and while the game progresses that wealth will be exchanged within players and between the players and the Bank.
The players decisions will cause certain exchanges of wealth both within the players and/or between players and Bank.
Every time players land on each other lands or stations they transfer a certain amount of wealth (money) to each other; the wealth is only transferred within players nothing goes to the Bank and nothing comes from it.
Players will also exchange wealth with the Bank, for instance when receiving $200 when passing “Go”, or having to pay a fine when getting out of jail.
The domestic private sector, hereby represented by the players cannot produce wealth, it can only move around the same amount of existing wealth. How can the players, hence the private sector increase the total amount of wealth? There is only solution, they need the Bank, hereby representing the domestic public sector, to lose some of its wealth.
The players cannot accumulate money if the Bank doesn’t lose some of it.
This happens for instance every time the players receive their $200 as they pass “Go”; the Bank loses 200 and the players gain 200.
Remember, the system is closed every flow from one sector has to go to the other sector; one’s win corresponds to someone else’s loss.
Gross Domestic Product
We have introduced what the macroeconomic sectors are and the way they interact through wealth exchanges.
We now need to move from an abstract 3 sectors system to the real world by quantifying their respective wins and losses, and for doing that we need an indicator, a measure of the wealth and income of a country, the Gross Domestic Product.
Our goal here is to identify and measure the balance of each of the 3 economic sectors. The balance represents the amount of “wealth” each sector holds, a positive balance corresponds to a positive wealth and vice-versa.
The Gross Domestic Product (GDP) is the most common indicator used to measure the output, or the aggregate income, of a country. It’s a pure accountancy measure so you shouldn’t be worry whether it is orthodox or heterodox.
There exist 3 different approaches for calculating the GDP:
- Expenditure approach: Sum of all expenditures by the different economic sectors
- Production approach: Sum of the total value of all the economic outputs after deducting the cost of intermediate goods
- Income approach: Sum of the income earned by all the factors of production
We will combine the expenditure and income approach in order to derive the balance of each of the 3 sectors, namely the sectoral balances.
Following the expenditure approach, GDP is obtained as a sum of 5 components:
- Consumption
- Investment
- Government Expenditure
- Export
- Import
GDP expenditure ⇒ GDP = C + I + G + X – M
= Consumption + Investment + Government Expenditure + Export – Import
This equation states that the total national income (GDP) is equal to the sum of final consumption expenditure (C), total private investment (I), total government expenditure (G) and net export (X-M).
From the income approach, we learn that GDP (national income) can be used for:
- Consumption
- Saving
- Tax payment
GDP income ⇒ GDP = C + S + T = Consumption + Saving + Tax payment
By equating the two GDP definitions, GDP expenditure = GDP income, we get:
C + S + T = C + I + G + X – M
And after rearranging the terms (C is cancelled out), we obtain an equation of the balance of the entire macroeconomic system. Each element of the equation belongs to one of the 3 sectors and not surprisingly the sum of all the elements is 0. A sum different than 0 would violate the closed-system principle introduced above.
T – G + S – I + M – X = 0
We now proceed to assigning each portion of the GDP to each sector of the economy. Each sector has its own balance identity, with relative outflows and inflows, defined in GDP terms.

The 3 fundamental balance identities:
Domestic public balance
Public revenue – Public expenditure →T – G
Domestic private balance
Private Saving – Private Investment →S – I
Foreign Balance
Import – Export →M – X

We can rewrite these 3 balance identities as follows, they are equivalent:
Government Net Lending ⇒ (G – T)
When the public sector expenditure (G) is higher than its revenue (T) the public sector is lending to either the private or the foreign sector, or both.
In case T is higher than G than the public sector is borrowing instead.
When the domestic public sector is a net lender it is in deficit while it is in surplus when it is net borrower.
Private Sector Net Financial Wealth ⇒ (S – I)
When the aggregate saving is higher then the aggregate investment the private sector is having a surplus of financial wealth, net accumulation of financial wealth.
Foreign Net Lending ⇒ (X – M)
When the export of a country exceeds the import it means that the foreign sector is lending hence it is in deficit with our domestic country.
The figure below gives you an idea on how the different flows move between the 3 sectors.

For the public sector, G is a wealth outflow (public spending) while T is an inflow (tax income, public revenue).
Import (M) and export (X) are respectively a financial inflow and outflow for the rest of the world.
Saving (S) and Investment (I) are endogenous to the private sector. This essentially means that the private domestic sector cannot accumulate financial wealth without the public and/or foreign outflows (we will deepen this concept in the coming paragraphs). What the private sector can do is to move wealth from one individual to another so that the internal distribution of wealth changes but the aggregate wealth remains the same, unless either the public or the rest of the world put more into it (by spending).
Let’s clarify this last paragraph by resuming our Monopoly game with a twist so that we can introduce the foreign sector.
We have seen that the private sector represented by the players cannot increase its wealth without the external injection from the public sector (namely the Bank).
As the game goes on, the players will keep exchanging wealth between them, some will increase the amount of money he has got (hence increasing saving, S) and some will decrease his saving every time he has to pay.
If someone picks an unlucky card from the community chest or ends up in jail he will have to transfer a certain amount of money to the Bank, he will be essentially paying a tax (T); but when he, for instance, passes “Go” he will instead receive money from the public sector (G).
In order to introduce the foreign sector we need a twist in the Monopoly rules.
Imagine if the players mentioned above are playing in the same room with other 250 groups of players, each group with its own game board.
If we allow the different groups to interact with each other, then we have included the foreign sector in our game (we have opened our economy…). We can for instance allow players to buy lands, to receive $200 or to pay jail fines from/to other boards.
With this new rules the players may end up buying a land from another group of players allowing them to receive money every time someone from the other group lands on an occupied land. This twist opens up the possibility to increase the players’ aggregate wealth not only by injection of their domestic public sector (the Bank of their board) but also by inflows coming from the domestic or public sectors of other game boards (namely the foreign sector). You can see this a sort of export (X).
Sectoral Balances and Stock-Flow consistency
The relation between the balances of the 3 sectors is a paramount component to consistently understand the fluctuations occurring in the economic system.

“… Borrowing flows build up as debt stocks.”
“… household borrowing must reach 14 percent of G.D.P. by 2010.”
“… wildly implausible. More likely, borrowing would level off ”
“… foresaw a looming recession but significantly underestimated its depth (2007)”
Just four striking paragraphs taken from an article appeared on the New York Times in 2013. Here you can read the entire article about Wynne Godley:
Embracing Wynne Godley, an Economist Who Modeled the Crisis, The New York Times
A Sectoral Balance model formalises the interaction between the 3 balances and the consequent impact on the whole macroeconomic system. The pioneer works on this approach were undertaken by the British economist Wynne Godley (for me one of the most important economist of all time).
Today this approach is widely recognised (from left to right) and exploited by major financial actors, and I believe that even most of the economists agree on that (both orthodox and heterodox).
As we saw in the previous paragraph, domestic public, domestic private and foreign sector, form the whole (global) macroeconomic system. This system as a whole, is closed and every outflow of one sector corresponds to the inflow of (at least) one of the other two.
It follows that the sum of the 3 sector balances is equal to 0, and it can’t be otherwise due to the system being closed. At a global level all outflows and inflows must sum to 0.
Hence,
Domestic Private Balance + Domestic Public Balance + Foreign Balance = 0 ,
which is equivalent to:
Government Net Lending + Private Sector Net Financial Wealth + Foreign Net Lending = 0 ,
or:
Domestic Public Deficit + Domestic Private Surplus + Foreign Deficit = 0 ,
and in GDP terms (following the GDP allocation to each sector):
(G – T) + (S – I) + (X – M) = 0.
From this simple relation we get 3 fundamental conclusions:
- The public deficit is equal to the private sector surplus plus/minus the foreign balance.
- If the government deficit increases the private net financial wealth also increases.
- A government running a deficit allows the private sector to accumulate financial wealth.
For the sake of simplicity, let’s consider a foreign sector in balance (X-M = 0) and focus on the relation between government deficit and private surplus:
(G – T) = (S – I).
The public deficit (G – T) is equals to the private sector surplus (S – I).
If the government deficit increases the private net financial wealth also increases.
A government running a deficit allows the private sector to accumulate net financial wealth. It follows that the private sector cannot create financial wealth without an exogenous injection provided either from the government sector or the foreign sector (or the government sector only in case of a closed economy).
You may object that this is not true since an individual can sell a good and receive money or can lend money to someone else, in both cases he is increasing his financial wealth. But this wealth increase is only limited to that individual (at micro level), at aggregate level (macro) the amount of wealth remains the same. If he sold a good, someone else must have bought it, likewise if he lent money someone must have borrowed it.
For every credit there has to be a debit as well as for each revenue there is a cost, so the private sector itself can just alter the distribution of the same amount of financial wealth but not create new one. Credits and debits offset at aggregate level!
This is the financial side, the real side is a different story, you can always exchange goods-for-goods (barter) or (if you have the skills) you can do some enhancement to your house that can eventually increases its market value. In fact, after offsetting all the credits with all the debits what is left is the real value of all the assets of the private sector.
At aggregate level, as long as there is enough liquidity/financial wealth in the private sector an increase in the investment expenditure generates an increase in profits hence income, hence saving. In a situation where aggregate investment exceeds aggregate saving the private sector is short of financial wealth and only an expansive fiscal policy from the government can restore the equilibrium.
Private and public exogenous expenditures have different impacts on the sectoral balances. The same rate of growth in income has varying implications for the domestic private sector’s financial balance (saving minus investment or, equivalently, disposable income minus private spending) depending on the composition of the demand driving that growth. An increase in private investment pushes the private sector toward deficit. Even though the investment boosts income, saving will not rise as much as investment because of leakage to taxes and imports. In contrast, government spending adds income and saving for a given level of investment. An implication is that growth driven by private expenditure that occurs without compensating growth in government spending pushes the private sector into deficit except to the extent that net exports counter the effect (this last concept will be clearer later on when we introduce the foreign sector in the sectoral balance equation).
An example on how the sectoral balances approach is recognised in the real world.
Here follows a statement from the Chief economist of global investment research at Goldman Sachs, you will notice that he is basically saying the same things that we went through so far.
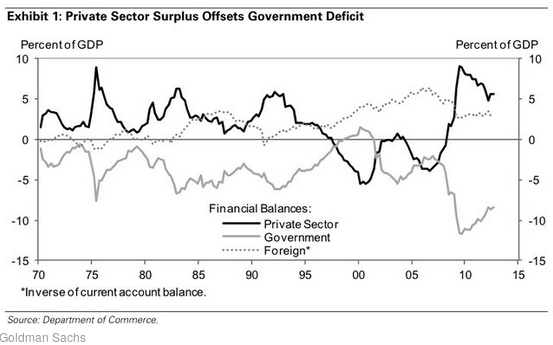
Extract from Business Insider – Goldman’s Top Economist Explains The World’s Most Important Chart, And His Big Call For The US Economy
“…every dollar of government deficits has to be offset with private sector surpluses purely from an accounting standpoint, because one sector’s income is another sector’s spending, so it all has to add up to zero. That’s the starting point. It’s a truism, basically. Where it goes from being a truism and an accounting identity to an economic
relationship is once you recognise that cyclical impulses to the economy depend on desired changes in these sector’s financial balances.”
Jan Hatzius – Chief economist of global investment research at Goldman Sachs
Full interview at Business Insider:
http://www.businessinsider.com/goldmans-jan-hatzius-on-sectoral-balar=US&IR=T&IR=T
If you notice in the title of the article, there is a mention to the “World’s Most Important Chart”, this chart is displayed below.
The graph is an empirical representation of the 3 balances identity (an represents an empirical proof of what we have learned so far):
the government deficit equals exactly the private sector surplus + the foreign surplus.
At each point in time the sum of the 3 balances is exactly 0, that’s why the graph resembles a mirror.
I produced the same type of chart for both USA and Sweden with data updated to 2022 Q4.
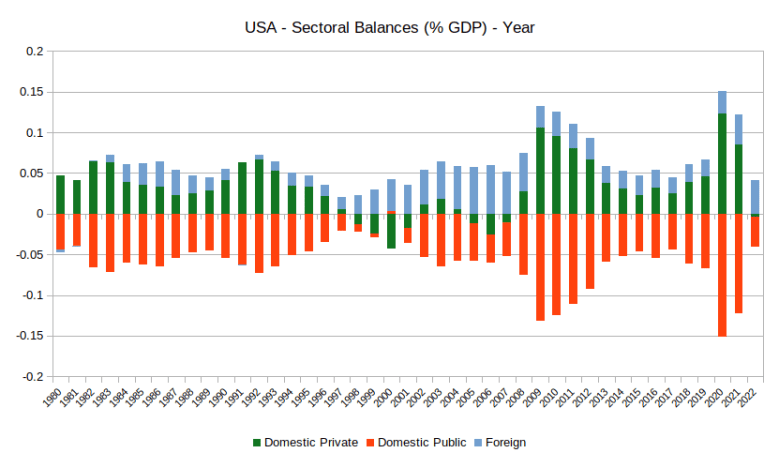 USA Sectoral Balances as percent of GDP
(FRED Graph Observations, Federal Reserve Economic Data, Economic Research Division, Federal Reserve Bank of St. Louis)
From the FRED website, you can find interactive and up-to-date USA sectoral balances: https://fred.stlouisfed.org/graph/?graph_id=794489
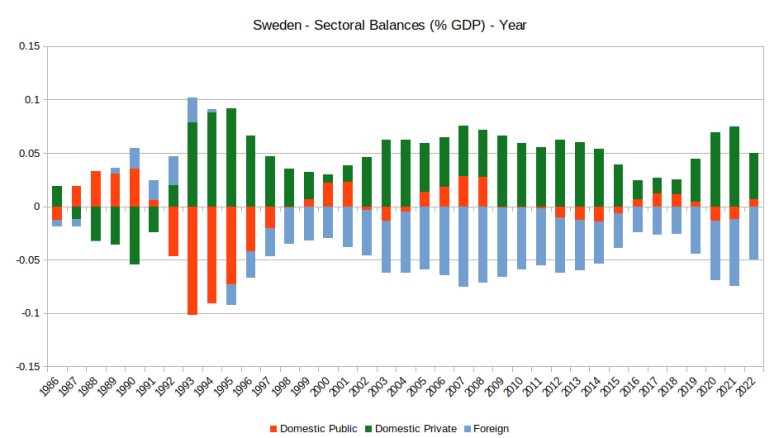
If you are interested in reproducing the Sectoral Balances chart for Sweden in an automated way (on both quarter and year basis) I have created a Python code that connects to the table API, collect and process the information:
https://github.com/onexcent/onexcent_site/blob/main/API_scb.py
From the Sectoral Balance model just introduced we can derive 5 fundamental macro-accounting principals:
- One’s Financial Asset is someone else Financial Liability:
- For every financial asset there must be an offsetting financial liability. If someone has a debit there must be someone else who has a credit.
- Net financial wealth of the private sector (Inside Wealth) is zero:
- Since every credit has an offsetting debit (and vice versa), the sum of all private sectors financial assets and liabilities has to be 0. This means that the private sector can not accumulate financial wealth without financial inflows from the public sector or the foreign sector (Outside Wealth).
- Private Net Wealth = Private Real Asset Value:
- In the previous point we state the private sector inside financial wealth is 0, this does not mean that the private economy has no wealth at all. After offsetting financial assets and liabilities what is left it the Real economy (+ cash)
- Net Private Financial Wealth = Public Debt:
- The outside wealth provided by the Public sector allows the accumulation of (Private) financial wealth hence, contrary to what mainstream economics believes, the Public debt of the government is the private sector wealth.
- Foreign Liabilities are Domestic Financial Assets:
- Together with the public sector, the foreign sector is also a source of Outside wealth.

Let’s build a realistic example in order to clarify the point 1, 2 and 3 above.
In this example we have one person (Person 1) and a company (Company 1).
1. Person 1 has cash, Company 1 has goods.
Both cash and goods lies on the asset side of the balance being respectively a financial asset and a real asset.
2. Person 1 buys £100 goods from Company 1 and pays at 30 days (credit).
Person 1 acquires goods for £100 and increases his its assets by $100 at the same time he got a credit from Company 1 for the same amount, thus Person 1 is now indebted toward the Company 1 and its financial liabilities increase by $100.
Company sold some of its goods stock which decreases from $1000 to $900, at the same time it increases its assets by $100 through the credit (financial asset) granted to Person 1.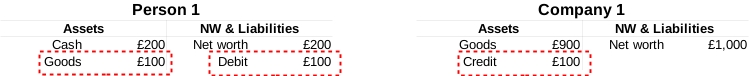
3. Person 1 pays Company 1, credits and debits are offset.
When Person 1 pays its debt the corresponding financial liability is cancelled. Company 1 receives the money, so its 100 credit is cancelled and replaced by another financial asset, cash.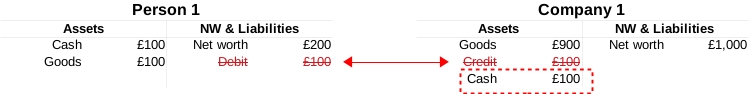
Stocks and Flows
From the sectoral balances we know that an increase in the public sector deficit leads to an equal increase in the private sector surplus and then this surplus allows the private sector to accumulate financial wealth.
Let’s put this in terms of stock and flows and make it clear with an example.

Example:
A household has an income of 2,000£ per month and a spending of 1,500£.
Every month it has a balance surplus (income greater than spending) of 500£, if we hypothesise that income and spending are constant over the course of the year, the household has 500£ of saving flow each month.
At the end of the year the sum of all the monthly flows accumulates to a stock corresponding to the accumulated households’ financial wealth (6,000£ = 500£ x 12).
If the same household had a spending of 2,500£ instead, there would be the opposite effect: a monthly budget deficit would generate and indebtedness flow of 500£ that at the end of the year would reduce the financial wealth by the 6,000£.

How can a sector run a deficit?
When domestic private individuals (households or firms) are in need of funding for spending or investing and are short of liquidity, they need to run a deficit.
They have got 2 options for running a deficit:
- Run down accumulated financial assets →Dissaving
- Acquire new IOUs*→ Borrowing
Both options will cause the private financial wealth to diminish. Either they borrow money from a bank or draw from their saving account their financial wealth decreases.
* An IOU, I-owe-you, is a financial liability, a debit.
Example: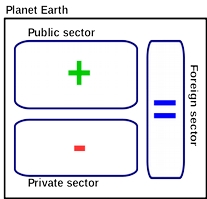
Consider a situation where the public sector goes in surplus and the foreign sector remains in balance.
By identity the private sector goes into deficit and it is forced to either:
→ draw from previously saved financial wealth and/or
→ borrow money
References and good readings:
Schlefer J. (September 10, 2013) Embracing Wynne Godley, an Economist Who Modeled the Crisis, The New York Times
Wray, L. R. (2012), Modern Money Theory – A primer on Macroeconomics for Sovereign Monetary System, Palgrave Macmillan
Godley W., Lavoie M. (2012), Monetary Economics – An Integrated Approach to Credit, Money, Income, Production and Wealth
Richard C. Koo (2011), The world in balance sheet recession: causes, cure, and politics
Wisenthal, J. (2012), Goldman’s Top Economist Explains The World’s Most Important Chart, And His Big Call For The US Economy
Coy P., Dmitrieva K. and Boesler M. (2019), Warren Buffett Hates It. AOC Is for It. A Beginner’s Guide to Modern Monetary Theory
Continue to Part II – Money and Money Things:
In the next part, Money and Money Things, we will explore Money. We will start with the differences between Orthodox and Heterodox. We will provide a definition of Money and explain why it is accepted. The last section focuses on the difference between Money and Money Things along side the different currency regimes.
